# From Demand Windows to Rack Capacity and Lifecycle Cash Cost
DIMAGGI AI technical paper | 4 October 2026
**Evidence boundary.** Study source `5c4c8434dd0f92556aed46b4ebcda0c11ae468de`. Results are deterministic synthetic planning outputs. Public physical specifications and third-party benchmark observations retain their separate original scope. Model QA does not establish independent technical acceptance, legal compliance, production availability or realized commercial outcomes.
## Abstract
How does a declared workload commitment survive a delivery calendar, physical constraints, reserved recovery inventory and acquisition cash cost? We examine a deterministic whole-month, whole-rack planner that composes existing cooling and policy owners. A synthetic two-site, two-generation scenario reserves every committed demand window, but produces $22.739 million in twelve-month gross cash cost, $11.672 million in net modeled revenue and negative $9.315 million project NPV. Adverse cases show how an isolated readiness failure can invalidate a longer commitment under an explicit all-or-none reservation policy. Doubling energy prices raises cost while leaving reserved capacity unchanged. These are consequences of stated inputs and accounting rules, not estimates of vendor performance, market profitability or production availability. Reproducibility requires the exact candidate, owner pin, normalized inputs, result hashes and denominator definitions retained with each finding.
## 1. Question and existing research
The narrow contribution is a calendar and asset ledger joining three questions:
1. Does sufficient qualified primary and independent recovery capacity exist throughout a declared demand window?
2. Which physical or timing constraint prevents a complete reservation, and which costs persist while capacity remains unused?
3. How do full acquisition cash cost, operating cost, revenue, financing and retirement assumptions reconcile over a specified horizon?
This paper extends the owning application's existing calendar and ledger interfaces. It does not recreate **Network vs More GPUs**, the scheduler paper, the cooling paper or their experiments. Their existing owners retain network performance, scheduling and thermal-model claims. The scheduler's [capacity-planning loop](https://github.com/dimaggi-ai/scheduler-vs-more-gpus/blob/eab6367668a4500b1afeff39a6c205fd17310fb5/capacity/planning/README.md) already separates observed history, a frozen forecast and synthetic replay. The lifecycle forecast bridge preserves that artifact's identity and coverage; no numerical forecast result is converted into these racks without workload/hardware calibration. This experiment begins with explicitly supplied rack requirements.
Regional service placement and request pricing remain separate owner models. This paper's country and failure-domain labels do not establish regional legal compliance or independence in an actual failure. The companion service paper can examine the interfaces without treating different synthetic examples as one deployment.
## 2. Experiment and methods
### Synthetic design and physical units
The baseline begins in November 2026 and spans twelve UTC calendar months. Two synthetic sites, Dublin and Frankfurt, each acquire four old-generation racks at month 0 and four replacement racks at month 7. Replacement delivery and commissioning occur at month 8; old racks drain at month 9 and retire at month 10. Each cohort withholds one physical warm spare. Critical demand uses two primary and two separately reserved standby racks, first for nine months on the old profile/hardware variant, then for three months on the new variant. A flexible training demand requests one old rack for nine months. Pipeline creates no reservation or sales.
**CL-02 - Physical specifications set scoped inputs.** Each illustrative rack contains three eight-device, 10U nodes, with assumed networking overhead. The B200 node ceiling is 14.3 kW. For B300, the source's physical table reports 14.5 kW while its power section specifies a 15 kW system maximum; the fixture retains the discrepancy and selects 15 kW conservatively. The resulting rack ceilings are `3 × 14.3 + 2 = 44.9 kW` and `3 × 15 + 2 = 47 kW`, with 24 devices per rack. The 2 kW network draw, rack arrangement, idle power, qualification, site cooling compatibility and all commercial numbers are synthetic assumptions. No throughput or cross-generation performance ratio follows from these counts. Sources: [NVIDIA B200 guide](https://docs.nvidia.com/dgx/dgxb200-user-guide/introduction-to-dgxb200.html), [NVIDIA B300 guide](https://docs.nvidia.com/dgx/dgxb300-user-guide/introduction-to-dgxb300.html), and the [fixture provenance](https://dimaggi.ai/assets/research/evidence/2026-10-04/dimaggi-planning-evidence-5c4c843.zip).
Rack spaces, peak IT kW, facility MW, feeder MW, expected kWh and qualified fabric rack limits are distinct quantities. The pinned cooling owner supplies PUE and admission verdicts. Every installed rack consumes peak headroom even when idle, spare, maintained or draining. Normal-operation electricity instead uses idle draw plus a primary-use increment. PUE is applied once. A separate full-peak electricity calculation is a stress view, not another operating expense.
### Calendar, inventory and allocation
Periods use actual month hours, not a universal 720-hour month. Intervals are half-open. Unknown readiness yields no supply; intramonth events require conservative input rounding. Cumulative acquired racks partition into installed, uncommissioned stranded and retired racks. Installed racks partition into available, physical warm spares, maintenance and draining racks. Demand standby reserves come from available inventory and are additional to physical spares.
Allocation orders committed before flexible, then criticality, priority and ID. A contract requires a consistent primary site, standby site and hardware variant throughout its active window. Standby uses the same qualified hardware variant and different supplied failure-domain and feeder identifiers. If any month fails, the planner reserves none of that contract's months. This deterministic first-fit procedure does not prove optimality; global rearrangement might rescue a refused case. A cooling `STAGGER` verdict withholds the affected start because completed sequencing is outside this model.
The primary denominator is **committed demand-months**, not rack-months or request availability. The baseline contains `9 + 3 = 12` such months, each requesting two primary racks and two standby racks. Flexible and pipeline months are excluded. Months without a feasible bundle and all months withheld by the reservation rule are reported separately.
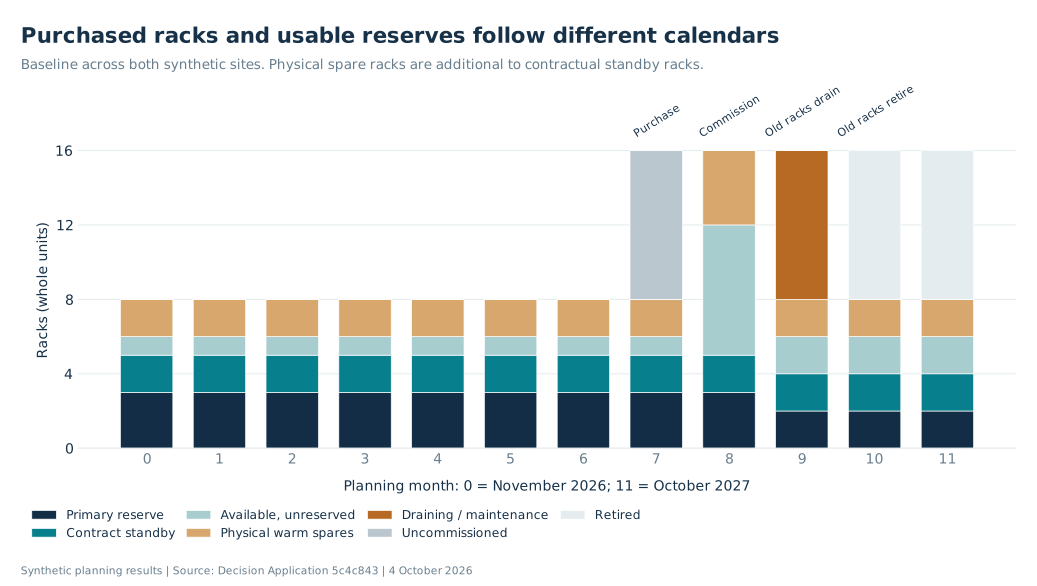
Figure 1. Every bar partitions acquired inventory exactly. Primary reserve includes committed inference and, in months 0-8, flexible training. Retired and uncommissioned assets are outside installed supply. Remaining installed racks retain their physical power burden even when they are not primary capacity. [Figure data (CSV)](https://dimaggi.ai/assets/research/capacity-lifecycle/capacity-timeline.csv).
### Energy and financial accounting
For cohort `c` and month `m`, with `h_m` hours:
```text
IT kWh = h_m × [installed racks × idle kW
+ Σ(primary racks × utilization × (peak kW - idle kW))]
facility kWh = IT kWh × owned PUE, plus separately counted site-base IT × PUE
```
Standby is warm idle in normal-operation energy. Acquisition is charged when purchased, including assets not yet commissioned. Site/support/platform costs begin at the horizon start; acquired unretired racks incur rack opex. The study assumes facilities remain open after rack retirement.
```text
gross horizon TCO = acquisition + site capex + energy + operating costs + disposal
net revenue = gross modeled revenue - credits
project cash = net revenue - gross cash costs + eligible resale
project NPV = Σ(project cash_m / (1 + monthly discount rate)^(m+1))
equity cash = project cash + debt draw - principal repayment - interest
```
All cash flows, including month-zero acquisition, are discounted at month end. The monthly discount rate is 0.008. Debt finances 60% of acquisition/site capex, accrues 0.5% monthly interest and repays each draw over 36 months beginning the following month. Opening cash is $2 million, not project income. Taxes, FX, inflation, depreciation and terminal enterprise value are absent. Debt and depreciation are not added to capex a second time. Cash gaps are displayed without an assumed rescue investment.
Committed service bills delivered reserved primary rack-hours. Flexible service bills those hours multiplied by assumed utilization, here 0.65. Refused and pipeline demand produce no invoice. Costs of standby and otherwise attributable inventory belong in the primary service bundle. These are nominal USD planning ledgers, not accounting recognition or signed commercial terms.
### Reproduction and evidence classes
Use the [reproducibility appendix](https://dimaggi.ai/assets/research/evidence/2026-10-04/README.md), its [manifest](https://dimaggi.ai/assets/research/evidence/2026-10-04/manifest.json) and the existing scenario runner; no alternative model is introduced. The owner is cooling-pue-ladder commit `735d8eb8196b70aa6beea759bc3c9470ce286a74`. Fixture replay and actual local owner-code execution have different labels. Both remain declared-input simulations. A digest checks content integrity; it does not authenticate an operator or prove observation.
The [scenario results](https://dimaggi.ai/assets/research/evidence/2026-10-04/frozen/scenario-results.json) bind the baseline and eight perturbations to their plans. The frozen reproduction executed the actual pinned cooling model and Go evaluator; all nine plan hashes and non-timing summary values match the saved final results. Independent arithmetic review checked calendar hours, physical partitions, reserved-plus-remaining inventory, revenue/credits, electricity and cost, then re-summed TCO, allocation dollars and NPV. Model QA is distinct from measuring any site or workload.
## 3. Findings
**CL-01 - Reservation feasibility and cash recovery answer different questions.** Baseline reservations leave zero of twelve committed demand-months unserved, while twelve-month gross TCO is $22,739,058.59, net revenue is $11,671,743.60 and project NPV is -$9,315,112.17. Gross cost includes $21.6 million hardware capex and $0.4 million site capex. Eligible resale is $1.6 million. Undiscounted net project cash is therefore -$9,467,314.99: net revenue plus resale minus gross cost. NPV instead discounts each monthly net cash flow at 0.8% per month, so it need not equal that undiscounted sum. The maximum modeled funding gap is $1,092,189.36 and closing debt is $10,566,666.67. The negative result is retained; it does not establish unprofitable lifetime operations, because the horizon fully charges purchases while leaving later service and financing obligations visible. [Frozen scenarios](https://dimaggi.ai/assets/research/evidence/2026-10-04/frozen/scenario-results.json).
**CL-03 - Whole-window reservations amplify a short readiness gap into a longer withheld commitment.** Results below round USD to millions; exact values remain in the artifacts.
| Case | Months without a feasible committed bundle | Withheld committed demand-months / 12 | Gross TCO, $M | Net revenue, $M |
| --- | --- | ---: | ---: | ---: |
| Baseline | None | 0 | 22.739 | 11.672 |
| New demand: two to five primary racks | New: 9-11 | 3 | 22.720 | 9.049 |
| Standby-site power ready at month 2 | Old: 0-1 | 9 | 22.667 | 3.888 |
| Standby-site fabric ready at month 2 | Old: 0-1 | 9 | 22.667 | 3.888 |
| Both energy tariffs doubled | None | 0 | 23.102 | 11.672 |
| Replacement commissioning at month 10 | New: 9 | 3 | 22.686 | 9.049 |
| Old primary cohort maintained at month 5 | Old: 5 | 9 | 22.690 | 3.888 |
| Sanitization reference absent | None | 0 | 22.739 | 11.672 |
| Feeder start-step limit: 0.05 MW | Old: 0-8; new: 9-11 | 12 | 22.415 | 0 |
Months are zero-based planning indexes. Two unavailable months do not become nine months of observed outage: nine is the refused contract's full window. In the startup-step case, the constraints also prevent the flexible training reservation, so total modeled revenue falls to zero even though flexible demand is excluded from the committed demand-month denominator. Startup withholding conserves the owner's transition refusal; it does not demonstrate that staged commissioning would fail. These cases are deterministic interventions, not frequencies, confidence intervals or SLA percentages. [Scenario definitions](https://dimaggi.ai/assets/research/evidence/2026-10-04/dimaggi-planning-evidence-5c4c843.zip), [frozen results](https://dimaggi.ai/assets/research/evidence/2026-10-04/frozen/scenario-results.json).
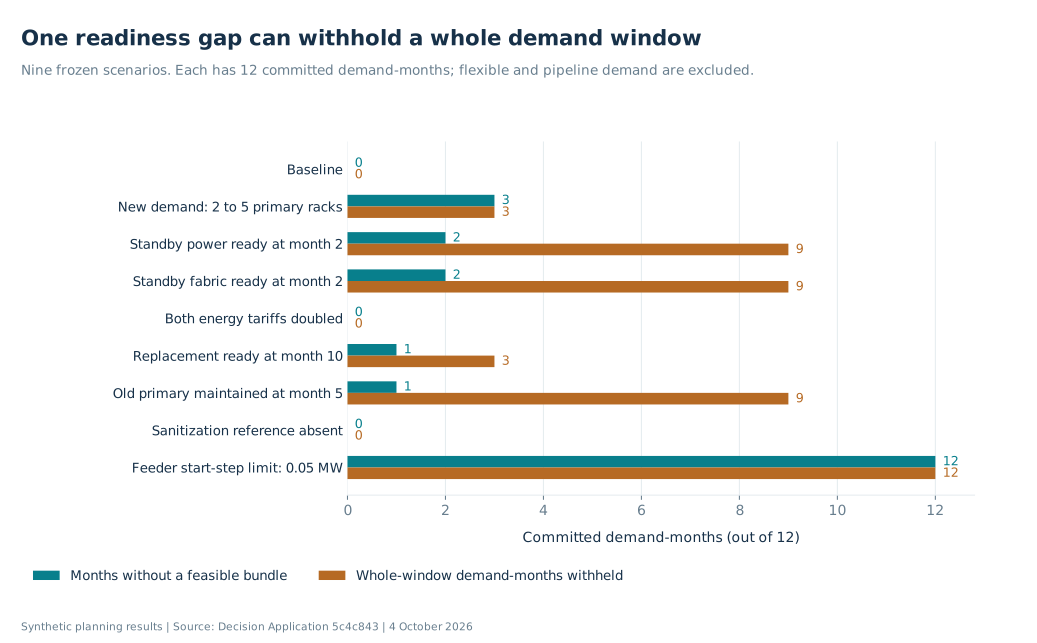
Figure 2. The model reserves a committed window only when every month fits one consistent primary/standby bundle. Amber bars are whole-window refusals, not measured outage duration or request availability. Values are counts over the same 12 committed demand-months. [Figure data (CSV)](https://dimaggi.ai/assets/research/capacity-lifecycle/refusal-windows.csv).
**CL-04 - A price perturbation changes cash cost without changing capacity.** Doubling both site tariffs adds $363,058.59, exactly the baseline energy-cost line, to gross TCO. Reservations and net revenue stay unchanged. This is an accounting sensitivity at fixed modeled energy, not evidence that real energy use is independent of price. [Frozen scenarios](https://dimaggi.ai/assets/research/evidence/2026-10-04/frozen/scenario-results.json).
**CL-05 - Evidence affects assumed resale without establishing sanitization.** Removing the sanitization reference withholds $1.6 million of resale, leaves gross TCO and service revenue unchanged, and lowers project NPV to -$10,780,842.69. The gate checks a supplied reference; it neither verifies erasure nor certifies legal compliance. NIST's publication concerns a sanitization program and suitable techniques and controls, a broader boundary than this string-level condition. [NIST SP 800-88 Rev. 2](https://csrc.nist.gov/pubs/sp/800/88/r2/final), [frozen scenarios](https://dimaggi.ai/assets/research/evidence/2026-10-04/frozen/scenario-results.json).
**CL-06 - Extending the horizon exposes obligations after sales stop.** The separate sixty-month scenario preserves the demand intervals while allowing both generations to retire and financing to mature. Its regenerated gross TCO is $24,627,740.66, including $32,000 disposal, with zero closing debt and project NPV -$10,771,074.10. Net revenue remains $11,671,743.60 because no later sales were added; final-month site opex remains $10,000. This is a runoff case with facilities left open, not a five-year business forecast. The [exact-source result](https://dimaggi.ai/assets/research/evidence/2026-10-04/frozen/full-lifecycle-result.json), plan `7ea954c6535be5cc2f3c8f581be442f5cc4aa09f84a1948597b914ccc8006ac8`, supersedes an earlier artifact with older governance/orchestrator hashes for this finding. Neither horizon supplies a terminal enterprise valuation or predicts realized investment returns.
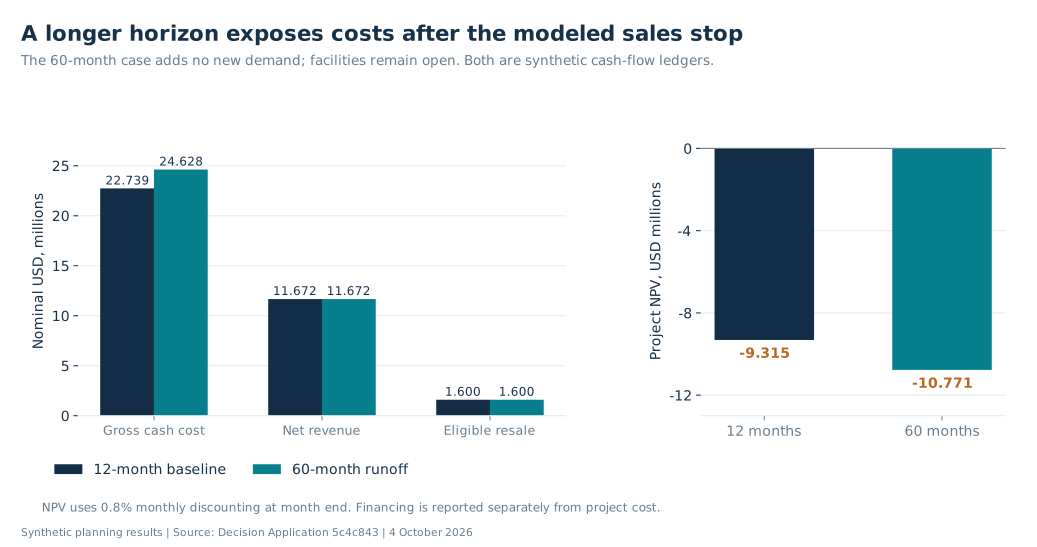
Figure 3. Gross horizon cash cost, net revenue and eligible resale are undiscounted amounts. The separate NPV panel discounts project cash flows. Negative findings remain visible. These horizons do not value an enterprise or estimate investment returns; they use identical sales intervals. [Figure data (CSV)](https://dimaggi.ai/assets/research/capacity-lifecycle/cash-horizons.csv).
**CL-07 - Cost-floor denominators preserve workload and recovery scope.** Baseline attributed costs yield the following planning floors; all three supplied selling-price bundles have negative modeled net margins.
| Bundle | Billable primary rack-hours | Cash-cost floor, USD/hour | Proposed floor with reserve, margin and credit cap, USD/hour |
| --- | ---: | ---: | ---: |
| Old-generation committed inference | 13,104 | 659.58 | 1,151.65 |
| New-generation committed inference | 4,416 | 2,797.60 | 4,884.70 |
| Flexible training | 4,258.80 | 408.96 | 714.06 |
Flexible billing uses `6,552 reserved rack-hours × 0.65`. The other rows bill reserved hours. Proposed floor equals cash-cost floor times `1.1 / (0.7 × 0.9)` for the declared risk reserve, target margin and credit cap. New-generation cost per hour is heavily affected by charging full acquisition into a three-month sales window; it is not a chip-efficiency comparison. Quote eligibility means modeled cost attribution is complete, not that the selling price exceeds the floor. Whole-project unattributed costs in refused cases remain visible and prevent a complete project-cost quote. [Economics contract](https://dimaggi.ai/assets/research/evidence/2026-10-04/dimaggi-planning-evidence-5c4c843.zip), [frozen baseline](https://dimaggi.ai/assets/research/evidence/2026-10-04/frozen/scenario-results.json).
**CL-08 - Timing is outside the published finding set.** Elapsed time retained in a replay receipt is run metadata. This public package makes no quantitative runner-speed claim because it does not include the raw historical benchmark measurements. A controlled end-to-end benchmark would be needed before drawing a scaling or latency conclusion. No production latency or availability target follows from the simulations.
**CL-09 - Reproducible QA and acceptance remain separate.** The frozen reproduction passed 186 Python tests and Go race checks. The public source bundle includes the original test sources and instructions for rerunning them. Artifact arithmetic and agent-assisted cross-checks are implementation QA, not independent technical acceptance. Test success and publication do not establish operational qualification. See the [public reproduction record](https://dimaggi.ai/assets/research/evidence/2026-10-04/README.md).
## 4. Further experiments
Additional experiments are required before broader claims: workload-matched power/performance calibration; a controlled comparison of whole-window versus explicitly permitted partial contracts; measured transition/ride-through sequences for `STAGGER`; sensitivity to utilization, capex, resale, contract length and discount rate; correlated-site failure and recovery drills; and an isolated runner benchmark including publication, concurrency and end-to-end memory. These are research questions, not new engineering tasks or completed measurements.
## Evidence checklist
| Findings | Public evidence | Interpretation check |
| --- | --- | --- |
| CL-01, CL-03, CL-04, CL-05, CL-07 | [Nine scenarios](https://dimaggi.ai/assets/research/evidence/2026-10-04/frozen/scenario-results.json) and complete content-addressed plans in the source bundle | Keep horizon, whole-window reservation policy, cash-flow denominator and negative results together. |
| CL-02 | Public physical specifications and the byte-exact source fixtures in the bundle | Maximum kW and device counts are not workload benchmarks. |
| CL-06 | [Sixty-month result](https://dimaggi.ai/assets/research/evidence/2026-10-04/frozen/full-lifecycle-result.json) | Runoff with unchanged demand intervals; no new sales forecast. |
| CL-08, CL-09 | [Public reproduction and test instructions](https://dimaggi.ai/assets/research/evidence/2026-10-04/README.md) | No published runner-speed claim or independent acceptance follows from implementation QA. |
## Reproducibility appendix
The [public evidence bundle](https://dimaggi.ai/assets/research/evidence/2026-10-04/dimaggi-planning-evidence-5c4c843.zip) contains the permitted byte-exact model source, tests, fixtures, frozen outputs and a packaging-only reproduction wrapper. The [manifest](https://dimaggi.ai/assets/research/evidence/2026-10-04/manifest.json) binds the exported files to source `5c4c8434dd0f92556aed46b4ebcda0c11ae468de`. [Reproduction instructions](https://dimaggi.ai/assets/research/evidence/2026-10-04/README.md) describe the environment, source verification, model execution and test commands. The cooling owner is pinned to `735d8eb8196b70aa6beea759bc3c9470ce286a74`. No hardware or cloud workload is executed.
The [clean-extraction validation receipt](https://dimaggi.ai/assets/research/evidence/2026-10-04/qa/extracted-validation.json) records 186 passing Python tests and successful Go race checks. The separate [reproduction receipt](https://dimaggi.ai/assets/research/evidence/2026-10-04/qa/extracted-reproduction-receipt.json) records equality for all nine scenarios, the 60-month plan, four CLI outputs and two calibration refusals. These receipts are implementation QA.
Unpack the archive into a new folder, read its README, and first run `python3 reproduce.py --verify-only`. Full replay requires Python 3.12, Go 1.26.1 and the named cooling-owner checkout; use the exact commands in the bundle. The original scenario outputs and their negative results remain unchanged. Variable elapsed-time metadata is excluded from numerical equality; it is not a new performance benchmark.
Source links in the body that target the archive refer to the path named in the link or adjoining text. Key files include `service_planning/lifecycle/experiments.py`, `service_planning/lifecycle/docs/CONTRACT.md`, `service_planning/lifecycle/docs/SOURCES.md`, the JSON examples, the pricing/placement/offer modules and their tests. The public bundle omits private coordination documents and does not expose the owning repository's full history.
## References
1. [NVIDIA DGX B200 User Guide: physical specifications](https://docs.nvidia.com/dgx/dgxb200-user-guide/introduction-to-dgxb200.html). Published node dimensions and maximum system power; no inferred workload throughput.
2. [NVIDIA DGX B300 User Guide: physical and power specifications](https://docs.nvidia.com/dgx/dgxb300-user-guide/introduction-to-dgxb300.html). The 14.5 kW physical-table entry and 15 kW maximum are retained separately.
3. [NIST SP 800-88 Revision 2](https://csrc.nist.gov/pubs/sp/800/88/r2/final). Media-sanitization program guidance; a reference string is not a sanitization attestation.
4. [Cooling PUE Ladder, exact source 735d8eb](https://github.com/dimaggi-ai/cooling-pue-ladder/tree/735d8eb8196b70aa6beea759bc3c9470ce286a74). Reused cooling owner; its model is executed, not measured plant behavior.
5. [Network vs More GPUs, existing paper](https://github.com/dimaggi-ai/network-vs-more-gpus/blob/3047ddb4f11e65c46b5bcab6f7674dd9fb3900e4/paper/main.pdf). The existing network paper retains its original research scope; this study adds no network benchmark.