Much as accelerator count describes potential; effective capacity is what remains after queueing, load imbalance, memory stalls, repeated prefill, rejected speculative tokens, host scheduling jitter, tool waits, and failed task attempts. Two deployments using the same accelerator class can deliver materially different effective capacity, because execution still depends on the host control path, and none of that difference appears in a specification sheet.
For agentic workloads we have seen this gap widen as the unit of work extends beyond a request. A task becomes a sequence of model calls, tool invocations, policy checks, and corrections, any one of which can repeat. Throughput measured in tokens per second stops describing the economics at that point. A system can raise token throughput while issuing more model calls, carrying larger contexts, or retrying more often, which makes the engine look faster while the workload gets more expensive.
The measure that survives is cost per successfully completed task. A parallel correction already exists on the serving side in goodput, which counts only requests finished inside a stated latency objective, where raw throughput credits late responses as successes. Published work is moving the same way on energy, with goal-level accounting frameworks proposing an Orchestration Overhead Index precisely because per-inference metrics cannot see what a retried loop costs (arXiv:2605.22883).
In conventional serving stacks, the control path runs on the host
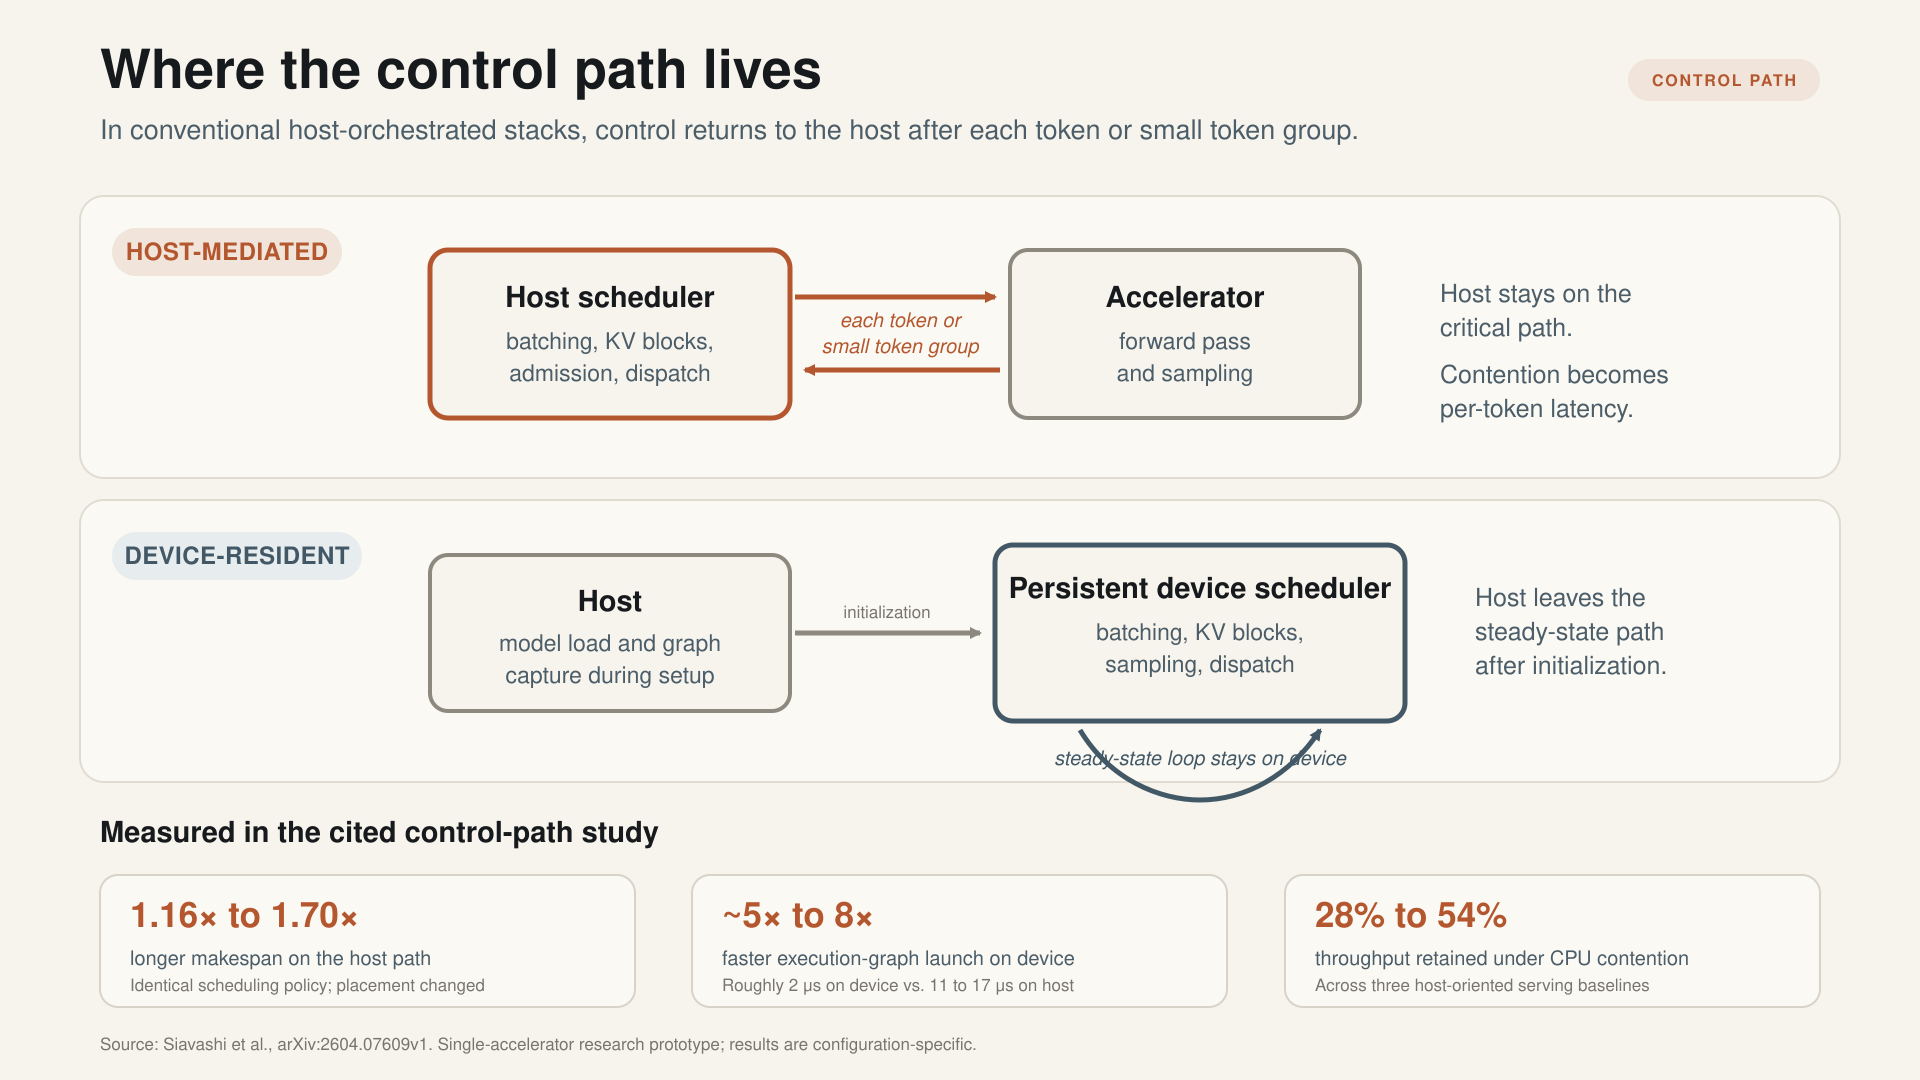
Where the per-token control loop executes determines how much host contention reaches the user. Measured figures from Siavashi et al., arXiv:2604.07609, a single-accelerator research prototype.
In conventional host-orchestrated serving stacks, autoregressive decoding returns control to the host after every generated token. Request admission, continuous batching, key-value block management, and kernel dispatch execute on host threads, and the scheduler comes back to update batch membership and dispatch the next step. Pre-captured execution graphs amortize individual launch costs. They do not remove the round trip. This host dependency is a property of the prevailing architecture, not of inference itself, which is precisely what the device-resident prototype below is built to remove.
Siavashi, Scazzariello, Maguire, Kostić, and Chiesa quantified what that placement costs in "Blink: CPU-Free LLM Inference by Delegating the Serving Stack to GPU and SmartNIC" (arXiv:2604.07609v1, April 2026). Holding the scheduling policy identical and moving only its location, the host-resident path inflated total makespan by 1.16 to 1.70 times, with the largest penalty on short-output workloads where the per-step round trip dominates compute. Device-side graph launch completed in roughly 2 microseconds against 11 to 17 microseconds host-side, which compounds to 4.6 to 7.7 milliseconds across a 512-token generation.
Before the numbers, the scope they come from. Every measurement in this piece is from a recent arXiv preprint, run on single nodes with models up to 32B parameters, and the device-resident system is a single-accelerator research prototype rather than a product. These are measured results from particular systems, not established properties of every deployment, and they should be read as strong directional evidence that happens to converge.
With that framing, the value proposition of relocating the loop is capacity you already own. The prototype reduced pre-saturation P99 time-to-first-token by up to 8.47 times and P99 time-per-output-token by up to 3.40 times, raised decode throughput by up to 2.1 times, and cut energy per token by up to 48.6%, in its controlled comparison. The cost is a substantial architectural commitment: a persistent device-resident scheduler, request handling moved onto a programmable network device, and direct memory access into accelerator memory. The transferable finding is the size of the orchestration tax, not the specific design.
One detail worth carrying into architecture reviews. Sparse mixture-of-experts models amplify the effect, because activating a small fraction of parameters per token shortens the device step while leaving per-step host orchestration cost unchanged. In that study the prototype's plateau-throughput advantage over the same host-coupled baseline widened from 8% on a dense model to 37% on a sparse one of comparable total parameter count. That is a gap against one baseline, not a general efficiency figure.
Host contention converts directly into tail latency
Under colocation with ordinary CPU-intensive work, three production serving stacks retained only 28% to 54% of their isolated throughput. The mechanism defeats the obvious fixes. The residual cost is host-side scheduling and dispatch jitter, and standard datacenter mitigations do not remove it: larger page sizes changed results within measurement noise, and cache partitioning cut the miss rate sharply while tail inter-token latency barely moved, because contention was never the binding problem.
Core pinning was the strongest single mitigation and still left roughly 17% fewer completed requests under interference, and it carries an economic problem of its own. At a minimum of six dedicated physical cores per accelerator, a dense eight-accelerator node consumes 48 cores, every core on a dual-socket 24-core-per-socket server and 38% of a 64-core-per-socket platform. Those cores sit idle between decode iterations and cannot be reclaimed without reintroducing the interference they were dedicated to prevent. Pinning converts a shared machine back into a dedicated one, which removes the reason to colocate at all.
The cleanest evidence that the accelerator is the victim rather than the cause: under interference, host-side operations inflated across the board while device-side matrix multiply held steady at 0.41 to 0.42 milliseconds per call. The accelerator was not slower. It was starved.
Tool execution pushes the bottleneck further toward the host
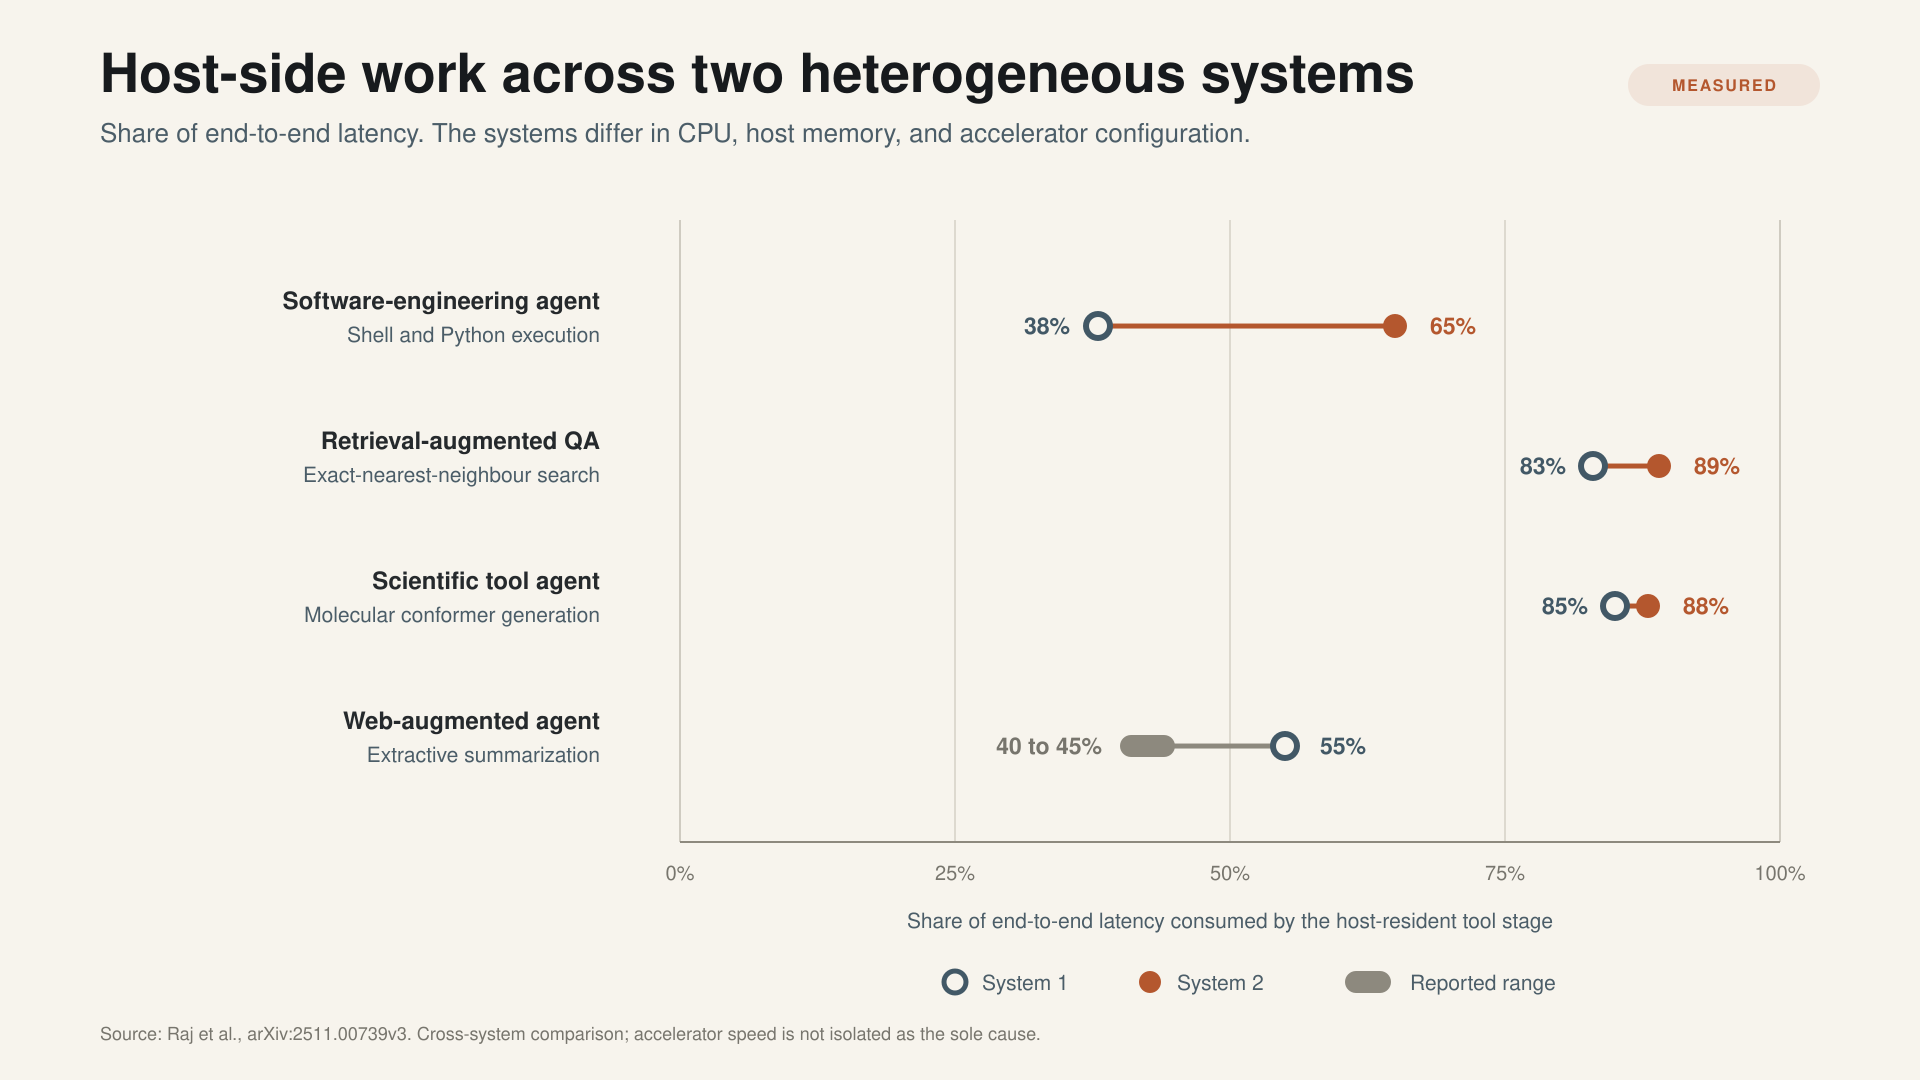
Share of end-to-end latency consumed by the host-resident tool stage, measured across two heterogeneous platforms with similar host core counts but different CPUs, memory systems, and accelerators. Data from Raj et al., arXiv:2511.00739v3. The web-augmented agent figure on the faster-accelerator platform is reported as a 40 to 45% band.
Agentic workloads add a second host-side load on top of the control path, and Raj, Kundu, Vohra, Wang, and Krishna measured it directly in "Towards Understanding, Analyzing, and Optimizing Agentic AI Execution: A CPU-Centric Perspective" (arXiv:2511.00739v3, April 2026). They profiled five agentic workloads on single nodes, across two heterogeneous platforms with similar host core counts but different CPUs, host memory systems, and accelerators. Because more than one variable changes between the platforms, this illustrates rather than isolates a cause.
Across those two platforms, the one with faster accelerator execution showed a larger host-side share. For a software-engineering agent running shell and interpreter execution, the host stage moved from 38% to as much as 65%. Retrieval-augmented question answering over a 115 GB corpus started host-bound at 83% and climbed to 89%. A tool-light workload drifted the same way from the other side, with model inference falling from roughly 88% of total latency to 77%. One case moved against the trend, where extractive summarization fell from 55% to a reported 40 to 45%. The pattern is consistent with host work becoming more visible as device execution contracts, which is the useful reading, not proof that accelerator speed alone drives it.
Precision matters on the headline figure, because it travels loosely. The authors summarize tool-dominated agentic workloads as spending up to 88% of end-to-end latency on host-side tool processing. In the underlying measurements the 88% and 89% cases are exact-nearest-neighbour vector search over a very large corpus and molecular conformer generation, both host-bound numerical compute rather than serialization or state-management overhead.
The commercially interesting consequence sits one step further on. In that study a high-performance host paired with the weaker accelerator matched the faster accelerator system on end-to-end latency for tool-dominated work. Where tool execution dominates, host specification buys more completed tasks per dollar than accelerator specification does.
Admission control is the highest-leverage scheduler parameter
Sizing concurrency to maximize accelerator utilization produces host over-subscription that leaves the accelerator idle. Call it the accelerator-first inversion, and it follows from a structural asymmetry: host parallelization is fundamentally less efficient than device parallelization, so host throughput saturates earlier than the batch-size curve suggests.
The measurement is unambiguous. The study reports a normalized host load ratio, where a value above one means the host is oversubscribed. A concurrency cap of 256, chosen at the knee of the accelerator throughput curve, drove that ratio to 3.09 and 3.18 at arrival rates of 13 and 14 requests per second, well into oversubscription. Capping at 64 instead held the ratio between 0.89 and 1.13, near full but not saturated, and delivered 2.9 times lower median service latency, 3.9 times at P90, and 1.7 times higher throughput. The published heuristic for the cap is one to two times the host core count.
That is a scheduler parameter. No silicon, no rack, no megawatt.
A second policy addresses mixed traffic. Where host-heavy and device-heavy requests share one admission queue, whichever type dominates arrivals monopolizes concurrency and starves the other despite the two stressing different resources. Type-aware admission with separate caps and a shared overflow reserve improved the minority request type by up to 2.37 and 2.49 times at P50 and P90, and by up to 10.1 and 8.8 times on a core-constrained platform where the host budget was tightest.
One implementation constraint deserves naming. In the tested CPython-based pipelines, compute-bound stages did not achieve true multicore execution through threads; multiprocessing improved performance, at higher memory and startup cost, and native extensions that release the interpreter lock can behave differently. The measured gap was 1.8 times at batch size 128. Where it applies, that constraint sets the practical core count, and it appears in no accelerator-denominated capacity model.
Energy follows the same path
For host-centric agentic workloads the host accounted for up to 61% of total system dynamic energy. Idle draw on one measured node was 140 W for the host against 142 W for the accelerator, which puts the two within noise of each other before any work is dispatched.
Moving the control path off the host cut energy per token by up to 48.6% in isolation and up to 70.7% under contention. The mechanism is mundane: all the systems compared drew similar wall power in the 1.1 to 1.4 kW range, so energy per token tracked inversely with throughput, and host contention that collapses throughput at constant power inflated energy per token by 69% to 182%.
That relationship is the reason energy claims need care. Higher throughput can raise rack power while energy per completed task falls, and the two numbers move in opposite directions on the same change. Only the second one describes efficiency.
One gain, four destinations, no free double-counting
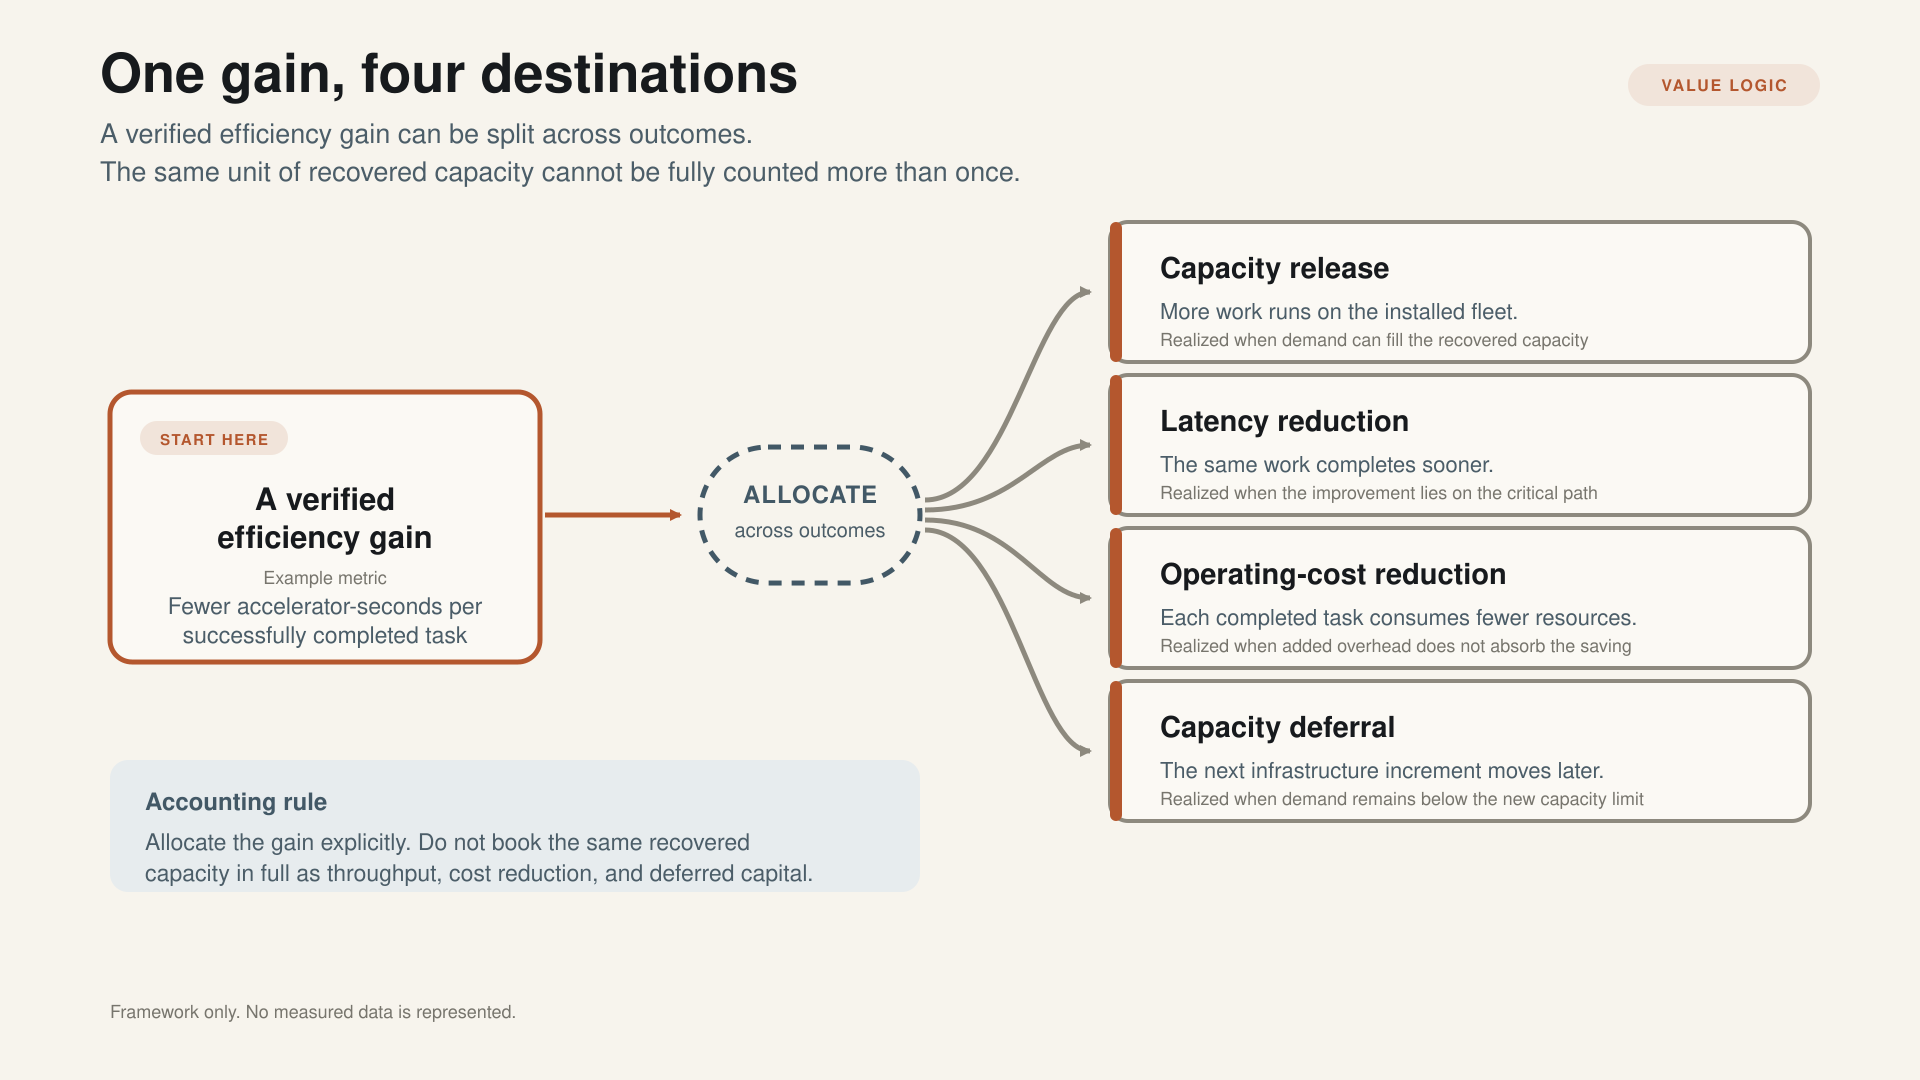
A recovered unit of capacity can be allocated across four destinations. The same unit cannot be fully counted in every category at once.
A recovered efficiency gain can be allocated across four destinations: lower cost, higher throughput, greater quality, or additional safety and verification headroom. An operator can split one gain across several of these. What is not available is counting the same unit of recovered capacity in full against every category, which is where most infrastructure business cases quietly break.
| Destination | What actually changes | Realized only when |
|---|---|---|
| Lower operating cost | Each completed task consumes fewer resources | The saving is not offset by added orchestration or lower utilization |
| Higher throughput | More work runs on the installed fleet | Demand exists and scheduling can fill the freed capacity |
| Greater quality | Freed budget funds more reasoning, retries, or verification per task | The task actually benefits from the extra work |
| Deferred capital | The next power, cooling, or rack increment slips | Demand growth stays below the new effective capacity |
Direct a throughput gain into serving more work and utilization rises while planned unit cost holds. Direct it into latency headroom and utilization falls, because reserving slack is how a tail objective gets protected. Direct it into deferred capital and an increment slips a quarter, which registers in no throughput metric at all. Each of these consumes some of the same recovered capacity, so a plan that books the full gain against two of them at once is counting the same unit twice, and that error is common enough to deserve a dedicated audit line.
A decision sequence for host-constrained workloads
These interventions come from different workloads, systems, and metrics, so they cannot be ranked against each other on a single scale. What they support instead is a conditional order: diagnose the binding constraint first, then act on it. The measured effects in parentheses are from the studies cited above and hold for those systems, not as universal gains.
- If the host load ratio exceeds safe operating headroom, address admission control first (capping concurrency near one to two times the host core count cut median and P90 service latency by 2.9 and 3.9 times and raised throughput 1.7 times).
- If mixed request types interfere in a shared queue, add type-aware scheduling (up to 2.37 and 2.49 times better latency for the starved type, and far more on a core-constrained host).
- If the per-token control path dominates, evaluate device-resident orchestration (1.16 to 1.70 times lower makespan at identical policy in the prototype, at the cost of an architectural rewrite).
- If tool execution dominates end-to-end latency, optimize or isolate the tool runtime and size the host tier to it (a stronger host offset a weaker accelerator on tool-dominated work).
- If none of these conditions holds, the workload is genuinely device-bound, and accelerator-side gains such as faster kernels or speculative decoding are the right target.
Three consequences follow regardless of which branch applies. Instrument the loop rather than the single pass, because model calls per task, prompt-cache reuse, tool wait, and retry rate determine cost while accelerator utilization does not. Treat host sizing as part of the accelerator sizing decision, since the host-to-accelerator ratio sets effective capacity for tool-heavy work. And when capacity is procured externally, price per million tokens describes an input, while model calls per task and completion rate describe the thing being bought.
The evidence in one place
Five measurements carry the argument. Each is from one of the cited systems under its stated conditions, not a universal constant.
| Finding | Measured effect | Source system |
|---|---|---|
| Control-path placement, policy held identical | Host-resident path added 1.16 to 1.70 times to makespan | Device-resident prototype, arXiv:2604.07609 |
| Host contention under colocation | Host-coupled stacks kept only 28% to 54% of isolated throughput | Same, three production serving stacks |
| Host-side share of tool-dominated latency | Up to 88 to 89% for retrieval and molecular tool stages | Agentic profiling, arXiv:2511.00739 |
| Admission control at the right load ratio | 2.9 and 3.9 times lower P50 and P90 service latency, 1.7 times throughput | Same |
| Energy per completed unit of work | Up to 48.6% lower in isolation, up to 70.7% under contention | Device-resident prototype |
Where the constraint lands next
Every optimization above relocates the bottleneck instead of removing it, which is the durable pattern and the reason capacity planning has to become a loop rather than a number. Faster decoding makes tool and host latency dominant. Better prefix reuse shifts pressure from compute onto memory capacity and network transfer. Larger batches raise throughput and degrade tail latency. Offloading key-value state raises concurrency and introduces resume-time stalls.
One boundary bears repeating alongside the scope stated earlier: the two studies measure different mechanisms, one the per-token control path and the other host-resident tool execution, and they happen to point the same way. That agreement is the reason to take the direction seriously. It is not a single result, and neither study measured the other's regime.
The position I would defend, and it is an argument rather than a measured claim: as optimization search becomes automated, verification throughput becomes the binding constraint. Generating a candidate kernel or a candidate scheduling configuration is getting cheap. Proving that a reordered floating-point computation is still correct at every shape, that a race does not surface only under load, and that a scheduling change has not quietly traded tail latency for throughput has not gotten cheaper at the same rate. An organization that can generate a thousand candidate optimizations and verify ten of them per week has a verification problem, not an optimization problem.
That ratio, candidates generated against candidates verified and deployed, is measurable, and it is rarely disclosed in public benchmark reporting.